
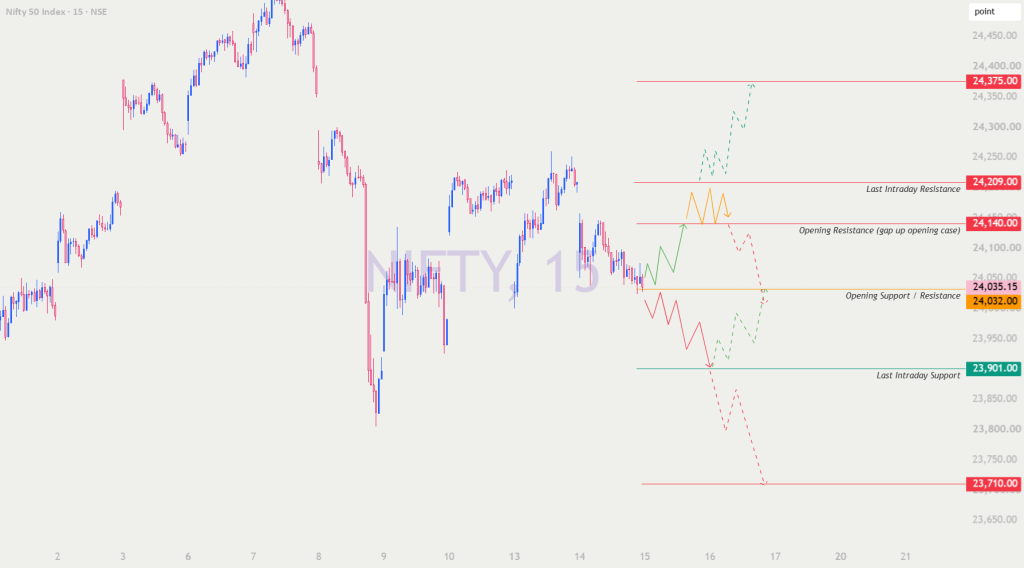
Hello Traders! 👋 Below is a complete, educational trading roadmap for NIFTY 50, covering Gap Up, Flat, and Gap Down (100+ points) opening scenarios. The plan is built around key support-resistance levels visible on the chart, along with practical risk management guidance for options traders. Please go through the entire plan before acting on any level. 🎯 🔑 Important Levels on Chart 🔸 Last Intraday Resistance → 24,375.00 🔸 Opening Resistance (relevant for Gap Up) → 24,140.00 🔸 Opening Support/Resistance (No-Trade Orange Zone) → 24,035.15 / 24,032.00 🔸 Last Intraday Support → 23,901.00 🔸 Extended Downside Level → 23,710.00 📌 Chart Legend: 🟠 Orange Line = Sideways/No-Trade Zone | 🟢 Green = Bullish/Long Bias | 🔴 Red = Bearish/Short Bias | Dashed Lines = Unconfirmed move (“trend may or may not sustain” — trade with caution and trail SL) 🟢 SCENARIO 1: GAP UP OPENING (100+ points → Open above ~24,135-24,150) 📚 Understanding the setup: A strong gap-up opening reflects positive overnight sentiment, but such openings frequently invite early profit booking. Confirmation before entry is essential — don’t chase the first candle. 🟢 Action Plan: 🔹 A sustained move and 15-min candle closing above 24,140 confirms bullish strength — this is your cue to look at Call Option (CE) buying on shallow dips near 24,140-24,150. 🔹 First target for the move → 24,209 (Last Intraday Resistance). 🔹 On a strong breakout and closing above 24,209, the door opens for an extended rally toward 24,375 — remember this is a dashed/unconfirmed zone, so keep trailing your stop-loss rather than holding blindly. 🔹 If price gaps up but immediately reverses near 24,140-24,150 with weak red candles (as shown in the orange zig-zag pattern), treat it as exhaustion — avoid fresh buying. Wait for price to retest 24,035 (Opening Support/Resistance) for the next directional clue. 🔹 Stop-Loss for long positions → Below 24,032 on 15-min closing basis. ⚠️ Risk Tip: Right after a gap-up open, option premiums are often overpriced due to IV spike. Let the first 15-min candle close before entering to avoid buying into inflated premiums. 🟠 SCENARIO 2: FLAT OPENING (Open within the 24,032–24,140 range) 📚 Understanding the setup: A flat open signals market indecision. This zone marked in orange is essentially a No-Trade Zone — both buyers and sellers are testing each other without a clear winner yet. 🟠 Action Plan: 🔹 If NIFTY opens flat around 24,035-24,040 and continues to oscillate between 24,032 (support) and 24,140 (resistance), refrain from directional option buying — sideways price action combined with time decay is a losing combination for buyers. 🚫 🔹 A confirmed breakout above 24,140 with strong volume → shift to the Gap Up bullish playbook (CE buying, targets 24,209 → 24,375). 🔹 A confirmed breakdown below 23,901 with strong volume → shift to the Gap Down bearish playbook (PE buying, target 23,710). 🔹 Experienced traders may explore premium-selling strategies (like Iron Condors or hedged Short Straddles) during this range-bound phase, since sideways movement favors time decay — but only with proper hedges in place. ⚠️ Risk Tip: Flat markets punish impatient option buyers the most. Wait for a clean breakout/breakdown candle close rather than guessing direction early. 🔴 SCENARIO 3: GAP DOWN OPENING (100+ points → Open below ~23,935) 📚 Understanding the setup: A sharp gap-down usually stems from negative global cues or heavy overnight selling pressure. However, gap-downs can either extend into panic selling or attract aggressive dip-buyers — so wait for confirmation. 🔴 Action Plan: 🔹 A sustained move and 15-min candle closing below 23,901 confirms bearish continuation — look at Put Option (PE) buying on pullback rallies toward 23,935-23,950. 🔹 First bearish target → 23,710 (extended downside zone). Since this is a dashed/unconfirmed level, keep trailing your SL as confirmation isn’t guaranteed. 🔹 If price gaps down but quickly reverses (dashed green recovery pattern) and reclaims 23,901, followed by a move back above 24,032-24,035, avoid fresh short positions — this hints at a V-shaped recovery. Wait for confirmation above 24,035 before considering long positions. 🔹 Stop-Loss for short positions → Above 24,032 on 15-min closing basis. ⚠️ Risk Tip: Gap-down opens often produce a “dead cat bounce.” Avoid shorting impulsively at the open — wait for a retest and rejection near resistance before initiating PE positions. 🛡️ Risk Management Tips for Options Trading 🔸 Always enter with a predefined Stop-Loss — never average into a losing options trade. 🔸 Limit risk per trade to 1-2% of total capital — options carry inherent leverage risk. 🔸 Avoid buying options in the first few minutes of market open — inflated IV can hurt entries. 🔸 Book partial profits at the first target and trail SL to breakeven to protect gains. 🔸 Avoid overnight option holding unless backed by strong technical/fundamental reasoning — theta decay is a buyer’s enemy. 🔸 Prefer hedged spread strategies over naked buying/selling to control downside risk. 🔸 Combine technical levels with OI data, PCR, and India VIX for stronger confirmation before entry. 📝 Summary & Conclusion Today’s structure revolves around three critical zones — 24,140 (Opening Resistance), 24,032-24,035 (No-Trade Zone), and 23,901 (Last Intraday Support). ✅ Gap Up (100+ pts): Sustained move above 24,140 → CE buying, targets 24,209/24,375. ✅ Flat Opening: Stay out between 24,032-24,140; act only after breakout/breakdown confirmation. ✅ Gap Down (100+ pts): Sustained move below 23,901 → PE buying, target 23,710; watch for reversal signs too. Successful trading is built on patience, discipline, and strict adherence to risk management — not on predictions. Trade your plan, not your emotions! 💪📈 ⚠️ Disclaimer I am not a SEBI registered analyst. This content is shared purely for educational purposes to help traders understand chart-based support-resistance concepts and risk management in options trading. This is not a recommendation to buy or sell any security. Please consult a qualified financial advisor and do your own research (DYOR) before making any investment or trading decisions. Trading in equities and derivatives carries significant financial risk. 🙏📉📈
Source: Read Full Article