
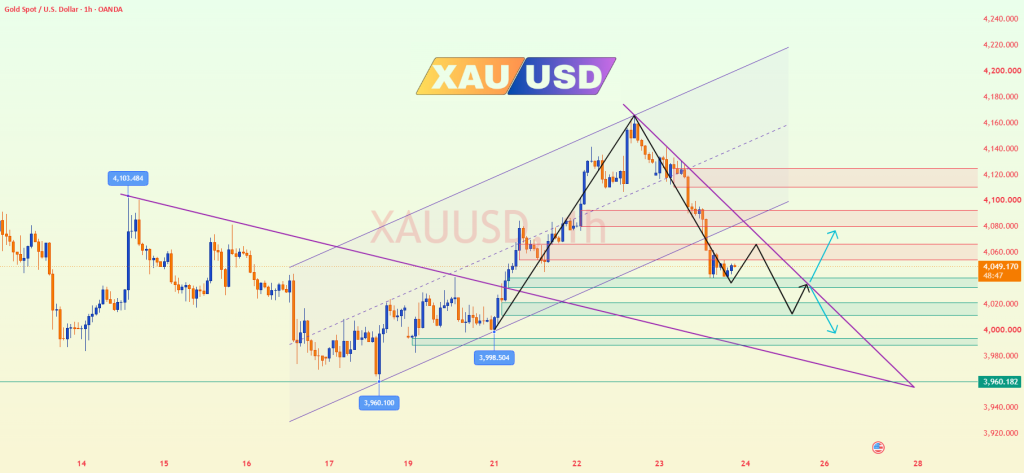
✅ 4-Hour Trend Analysis On the 4-hour chart, gold has fallen below the MA5, MA10, and MA20, and has also moved back below the MA200. The short-term structure has clearly weakened, shifting from a bullish rebound into a consolidation phase with a bearish bias. The key support level to watch is around 4035. If this level holds, gold may experience a technical rebound. However, unless the price recovers the 4082–4100 zone and stabilizes above it, any upward move should still be viewed as a corrective recovery after the decline rather than the beginning of a new bullish trend. If gold decisively breaks below 4035 on the 4-hour chart, the next downside target may be the 3993–3989 area. ✅ 1-Hour Trend Analysis On the 1-hour chart, gold has continued to form lower highs and lower lows since falling from the 4166 high. It has also broken below the previous ascending trendline and the 4082 support level, confirming a clear short-term bearish trend. However, the price is currently approaching the lower Bollinger Band and has begun consolidating around 4040. This suggests that an oversold technical rebound may occur following the recent decline. The key resistance zone is located between 4055 and 4065. If the price fails to recover above this area, the possibility of another decline will remain. Short-term selling pressure would only ease significantly if the price breaks above 4082 and holds firmly above 4090. 🔴 Key Resistance Levels ● 4055–4065: Short-term resistance zone ● 4082–4090: Key resistance zone ● 4100–4125: 4-hour resistance zone ● 4135–4160: Major resistance zone 🟢 Key Support Levels ● 4040–4035: Short-term support zone ● 4023–4015: 1-hour lower Bollinger Band support ● 3993–3989: 4-hour lower Bollinger Band zone ● 3959–3950: Previous low support zone ✅ Trading Strategy Reference 🔰 Sell on Rebounds 👉 Sell zone 1: 4055–4065 👉 Sell zone 2: 4082–4090 🎯 Targets: 4035 → 4023 → 3993 🛑 If the price breaks above 4100 decisively and holds firmly above it, the short-term bearish strategy should be reassessed. 🔰 Short-Term Buying Near Support 👉 Buy zone 1: 4035–4023 👉 Buy zone 2: 3993–3989 🎯 Targets: 4055 → 4082 → 4090 🛑 Long positions are counter-trend rebound trades and should only be considered after a clear bullish reversal or price stabilization signal appears. If the price breaks decisively below 3989, avoid blindly buying while the decline continues. 🔔 If you find this analysis helpful, please like, share, and stay tuned for future updates. Your support motivates me to continue sharing professional market insights. Wishing everyone successful trades and consistent profits!
Source: Read Full Article