
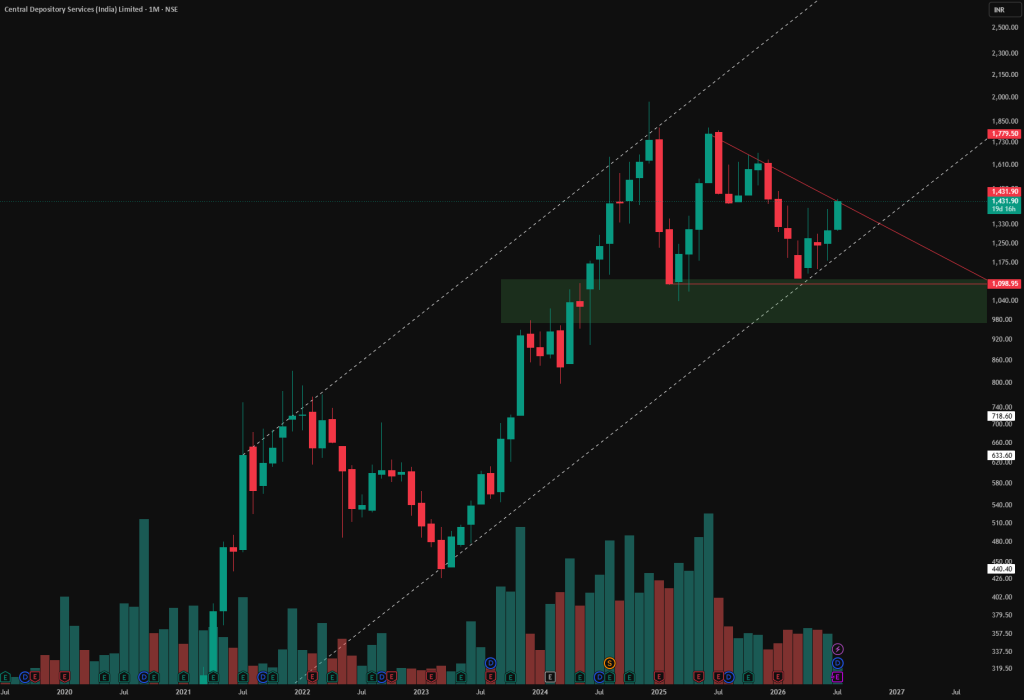
This post is educational and observational in nature based on historical price action. It is not a forecast or a trading recommendation. The Two Parallel Channels -Marked with dotted white lines are two parallel channel structures on this chart, an upward one and a downward one, each telling a different part of the story. -The downward parallel channel contains price within two descending parallel lines, and the breakout here happened by moving outside this channel, meaning price broke free of the falling structure entirely. -The upward parallel channel works differently in this context. Its lower boundary is being treated as a trendline support, meaning the same rising line that once contained price within the channel is now acting as a floor that price is respecting from above. -Together these two channels show how the same tool can serve two different purposes depending on the direction of the structure and where price is positioned relative to it. The Descending Triangle Pattern Marked in red is a descending triangle, formed by a flat support base at the bottom with a series of lower highs pressing down against it. This pattern typically reflects a struggle between sellers who are gradually stepping in earlier and buyers defending a consistent floor. Disclaimer: This post is purely educational and observational in nature based on historical price action. It does not constitute financial advice, a forecast, or a recommendation to buy, sell, or hold any security.
Source: Read Full Article