
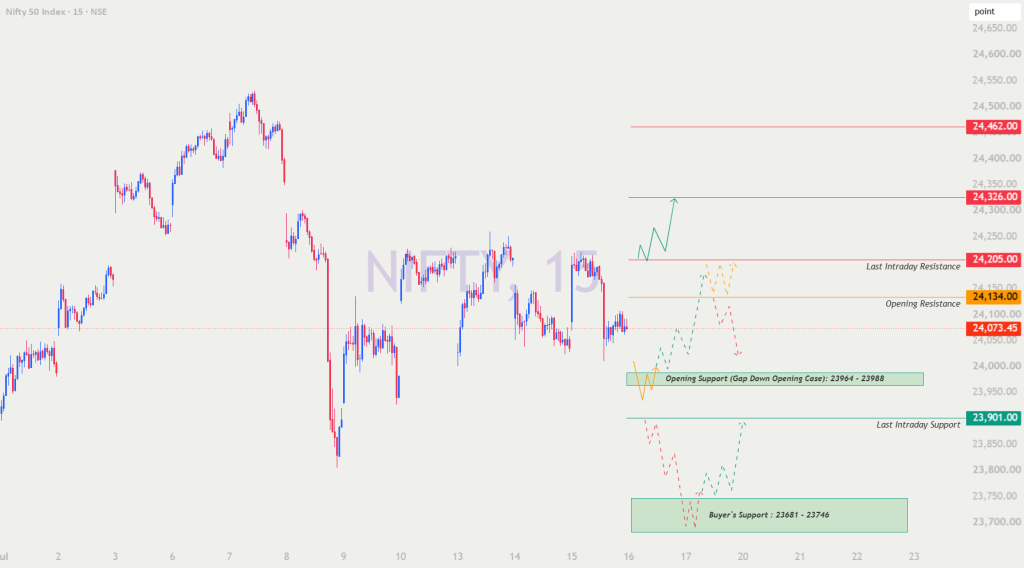
Hello Traders! 👋 Here’s your complete educational trading roadmap for NIFTY, covering all three opening scenarios — Gap Up, Flat, and Gap Down (100+ points). This plan is designed around key support-resistance zones visible on the chart, with practical insights for options trading. Read the entire plan carefully before executing any trades. 🎯 🔑 Key Levels to Monitor 🔸 Major Resistance Zone → 24,462.00 (extended target) 🔸 Intermediate Resistance → 24,326.00 🔸 Last Intraday Resistance → 24,205.00 🔸 Opening Resistance (No-Trade Orange Zone) → 24,134.00 🔸 Opening Support Zone (Gap Down Case) → 23,964 – 23,988 🔸 Last Intraday Support → 23,901.00 🔸 Buyer’s Support Zone → 23,681 – 23,746 📌 Chart Color Guide: 🟠 Orange Line = No-Trade/Sideways Zone | 🟢 Green = Bullish/Long Bias | 🔴 Red = Bearish/Short Bias | Dashed Lines = Below chart = Possible continuation (trend “may or may not” sustain — lower confidence, trail SL actively) 🟢 SCENARIO 1: GAP UP OPENING (100+ points → Open above ~24,205-24,230) 📚 Understanding the Setup: A strong gap-up opening of 100+ points indicates positive overnight sentiment or favorable global cues. However, such openings often attract profit booking from early buyers, so patience and confirmation are crucial before entering longs. 🟢 Trading Action Plan: 🔹 If NIFTY opens above 24,205 and the first 15-min candle closes above this level with volume support, it confirms bullish strength. Look for buying opportunities via Call Options (CE) on minor dips near 24,205-24,220. 🔹 First target on sustained momentum → 24,326 (intermediate resistance level). 🔹 If 24,326 breaks with strong volume and candle confirmation, next extended target zone opens towards 24,462 (dashed green zone — since this is below-chart projection, trend “may or may not” sustain, so trail stop-loss aggressively). 🔹 If price opens with a gap up but fails to sustain above 24,205 and starts showing weakness/rejection patterns (as visible in orange zig-zag on chart), avoid fresh long entries — this signals exhaustion. Wait for price to retreat back to 24,134 (Opening Resistance/No-Trade Zone) for fresh directional confirmation. 🔹 Stop-Loss for long positions → Below 24,134 on 15-min closing basis. ⚠️ Options Risk Tip: At gap-up opens, option premiums are typically inflated due to IV spike. Avoid impulsive buying right at open — wait for first 15-min candle confirmation to spot realistic premium levels. 🟠 SCENARIO 2: FLAT OPENING (Open between 24,134–24,205 range / ±50-70 points) 📚 Understanding the Setup: A flat opening signals market indecision — both bulls and bears are in equilibrium. This white zone between opening levels is essentially a No-Trade Zone where price action lacks clear direction. 🟠 Trading Action Plan: 🔹 If NIFTY opens flat within the 24,134-24,205 range and continues consolidating sideways, avoid directional option buying 🚫 — time decay (theta) works against buyers in ranging markets. 🔹 Watch for a decisive breakout above 24,205 with volume and 15-min candle closure → Then deploy the Gap Up bullish strategy (CE buying, targets 24,326 → 24,462). 🔹 Watch for a decisive breakdown below 24,134 with volume and 15-min candle closure → Then wait for further breakdown of 23,988 (Opening Support upper band) before considering short positions or shift to Gap Down bearish strategy. 🔹 Range-bound traders with experience may consider defined-risk strategies like Bull Call Spreads or Bear Put Spreads within this zone, but only with proper hedging and position sizing. ⚠️ Options Risk Tip: Flat/sideways markets are where most option buyers lose money due to premium erosion even when direction eventually moves. Discipline to wait for clear breakout/breakdown is the edge. 🔴 SCENARIO 3: GAP DOWN OPENING (100+ points → Open below ~23,988-23,960) 📚 Understanding the Setup: A gap-down opening below the opening support zone (23,964-23,988) typically reflects negative sentiment or heavy overnight selling pressure. Such moves can either extend into panic selling or attract institutional dip-buying — confirmation is the differentiator. 🔴 Trading Action Plan: 🔹 If NIFTY opens below 23,988 and sustains weakness with a 15-min candle closing below 23,964 (lower band of Opening Support), it confirms bearish momentum. Look for shorting opportunities via Put Options (PE) on pullback rallies toward 23,988-24,010. 🔹 First bearish target → 23,901 (Last Intraday Support zone). 🔹 On sustained break below 23,901, extended downside opens toward 23,746-23,681 (Buyer’s Support Zone). This is a dashed red zone below chart — trend continuation “may or may not” happen, so trail SL diligently. 🔹 If price gaps down but immediately shows strong reversal/recovery (as shown in dashed green recovery pattern below chart) and reclaims 23,988, avoid fresh shorts — this indicates strong dip-buying interest. Wait for confirmation above 24,134 for potential long-side entries using the breakout strategy. 🔹 Stop-Loss for short positions → Above 24,134 on 15-min closing basis. ⚠️ Options Risk Tip: Gap-down opens often witness a “reflex bounce” or dead cat bounce. Never short impulsively at the open — wait for retest and rejection near resistance before entering PE positions for better risk-reward. 🛡️ Risk Management Guidelines for Options Trading 🔸 Always define your Stop-Loss before entry — never exit based on hope or average down on losing positions. 🔸 Limit risk exposure to 1-2% of total capital per trade — options are leveraged instruments where capital preservation is priority #1. 🔸 Avoid option buying during the first 5-10 minutes of market open due to inflated premiums and high volatility. 🔸 Book partial profits (50%) at first target and trail SL to breakeven — protect gains from sudden reversals. 🔸 Avoid overnight holding of option buying positions unless backed by strong conviction — theta decay accelerates overnight. 🔸 Prefer spread strategies (debit/credit spreads) over naked buying/selling to control risk during choppy sessions. 🔸 Cross-verify technical levels with open interest data, PCR ratio, and India VIX for additional confirmation before major entries. 🔸 Maintain a trading journal to track what works and what doesn’t — self-analysis is the best teacher. 📝 Summary & Conclusion Today’s structure centers around three critical decision zones: 24,134 (No-Trade/Opening Resistance), 23,964-23,988 (Opening Support), and 23,901 (Last Intraday Support). ✅ Gap Up (100+ pts): Sustained close above 24,205 → CE buying, targets 24,326/24,462. SL below 24,134. ✅ Flat Opening: Stay out between 24,134-24,205; act only after confirmed breakout/breakdown. ✅ Gap Down (100+ pts): Sustained close below 23,964 → PE buying, target 23,901/23,746. Watch for recovery above 23,988 to exit shorts. Trading success is a marathon, not a sprint. Discipline, patience, and mechanical execution of your plan separate consistent traders from the rest. Trade what you see, not what you hope! 💪📈 ⚠️ Disclaimer I am not a SEBI registered analyst. This content is strictly for educational purposes only to help traders understand technical analysis concepts, support-resistance levels, and risk management frameworks in options trading. This is not financial advice or a buy/sell recommendation. Please conduct your own research (DYOR) and consult a certified financial advisor before making any investment or trading decisions. Trading in equities and derivatives involves substantial risk and may not be suitable for all investors. Past performance is not indicative of future results. 🙏📉📈
Source: Read Full Article